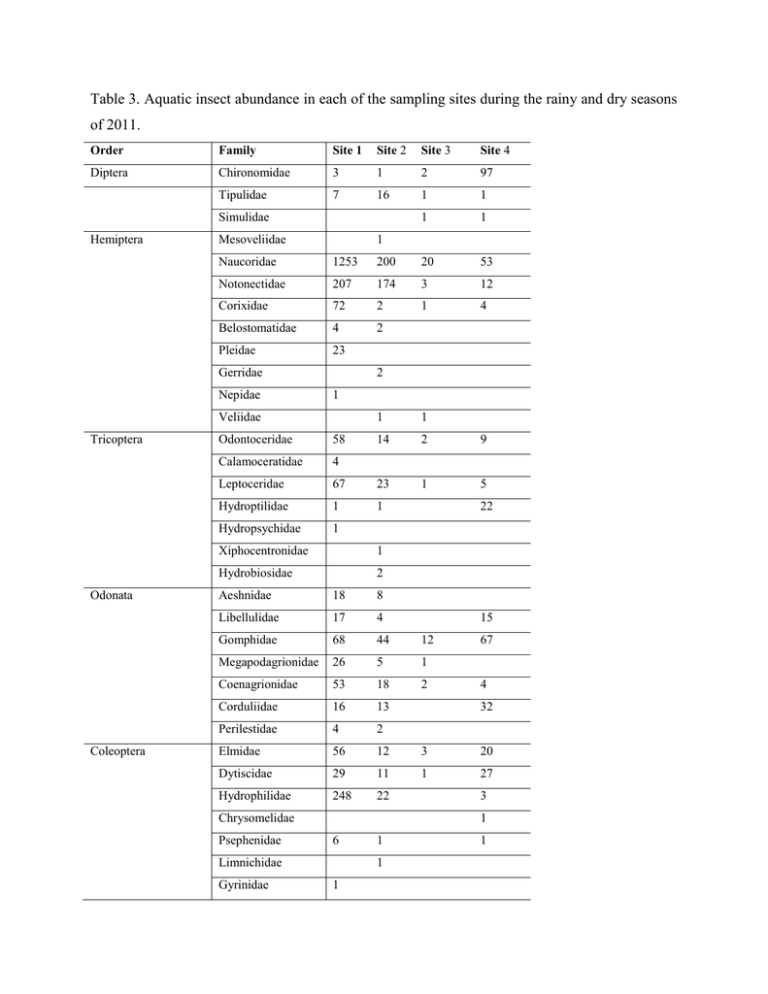
Table 3. Aquatic insect abundance in each of the sampling sites during the rainy and dry seasons
of 2011.
Order
Family
Site 1
Site 2
Site 3
Site 4
Diptera
Chironomidae
3
1
2
97
Tipulidae
7
16
1
1
1
1
Simulidae
Hemiptera
Mesoveliidae
1
Naucoridae
1253
200
20
53
Notonectidae
207
174
3
12
Corixidae
72
2
1
4
Belostomatidae
4
2
Pleidae
23
Gerridae
Nepidae
2
1
Veliidae
Tricoptera
Odonata
Coleoptera
1
1
14
2
9
1
5
Odontoceridae
58
Calamoceratidae
4
Leptoceridae
67
23
Hydroptilidae
1
1
Hydropsychidae
1
Xiphocentronidae
1
Hydrobiosidae
2
22
Aeshnidae
18
8
Libellulidae
17
4
Gomphidae
68
44
12
Megapodagrionidae
26
5
1
Coenagrionidae
53
18
2
Corduliidae
16
13
Perilestidae
4
2
Elmidae
56
12
3
20
Dytiscidae
29
11
1
27
Hydrophilidae
248
22
Chrysomelidae
Psephenidae
67
4
32
3
1
6
Limnichidae
Gyrinidae
15
1
1
1
1
Megaloptera
Corydalidae
1
Ephemerotera
Baetidae
19
Oligoneuriidae
1
Leptohyphidae
8
1
Leptophlebiidae
11
6
Caenidae
1
1
Euthyplociidae
137
26
Pyralidae
6
1
Total specimens*
2427a
687b
Total families*
Shannon-H
Equitability-J
BWMP*
ASPT
33a
32a
15b, c
22a, c
1.95
2.28
1.80
2.40
0.65
0.66
0.77
208a
87b
127b
6.7
5.4
5.5
Lepidoptera
1
71
39
23
6
1
90c
* Different letters indicate significant differences at p≤ 0.05.
405b
